Introduction
HMRC publishes annual statistics on the uptake and cost of R&D tax reliefs each year. The September 2025 release provides data for the tax year 2023–24 and revised figures for previous years. Below we summarise key findings from this latest report including the number of claims, amounts of relief, breakdowns by company size, region, and industry, and year-on-year trends.
Key Highlights (Tax Year 2023–24)
Total R&D tax relief support:
Companies claimed about £7.6 billion in R&D tax credits for 2023–24, a slight decrease of 2% from the previous year. This corresponded to approximately £46.1 billion in qualifying R&D expenditure, down 1% year-on-year.
SME vs large company schemes:
The SME scheme (for small and medium-sized enterprises) accounted for roughly £3.15 billion of the relief, 29% less than the prior year, while the RDEC scheme (Research and Development Expenditure Credit, used primarily by larger companies) rose to £4.41 billion, up 36%. For the first time, large-company RDEC claims now make up the larger share of total relief.
Number of claims:
An estimated 46,950 R&D tax credit claims were filed for 2023–24, a sharp 26% drop in volume compared to 2022–23. This decline was driven mainly by fewer SME claims – the count of claims under the SME scheme fell by about 31% – whereas claims under RDEC (mostly large companies) fell by only 5%.
Larger average claim size:
The steep fall in small claims (those worth under £15k of relief) resulted in a 33% increase in the average claim value versus the previous year. In other words, although many companies (especially small firms) stopped claiming, those that did claim tended to claim higher amounts, so the total support only fell slightly despite the drop in claim numbers.
Regional concentration:
As in past years, claims are concentrated around the London and South East regions. Companies with registered offices in London filed 24% of all claims and received 31% of the total relief value, the highest of any region. The South East accounted for 15% of claims and 20% of relief, followed by the East of England with 10% of claims and 13% of relief. (Note that a company’s registered address may not reflect where the R&D activity actually occurs.)
Top industries:
Three sectors dominated R&D tax credit usage: Information & Communication, Manufacturing, and Professional, Scientific & Technical activities. Together, these sectors made up about 72% of all R&D tax credit claims and 71% of the total amount claimed in 2023–24. Each of these sectors also received a large share of the relief (approximately 21%, 26%, and 24% of total relief, respectively). Other sectors had significantly smaller contributions.
R&D Tax Credit Claims: Volume Trends
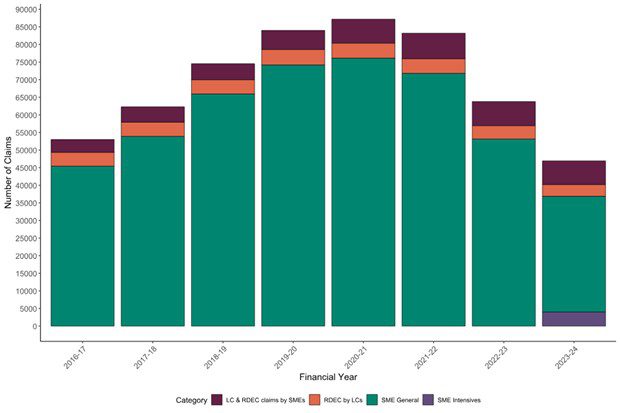
The total volume of R&D tax credit claims has dropped markedly. In the tax year 2023–24, there were an estimated 46,950 claims in total – 26% fewer than in the previous year. This decline follows a similar drop observed in 2022–23, indicating a downward trend after years of growth. The fall in 2023–24 is largely attributed to a reduction in SME claims. Out of the total, 36,885 claims were made under the SME tax credit scheme (down about 31% year-on-year) while 10,065 claims were under the RDEC scheme for large companies or certain ineligible SMEs (down about 5%). In the RDEC figures, roughly one-third of claims (3,335) came from large companies and the rest (6,730 claims) were from SMEs claiming RDEC (for example, SMEs conducting subsidized or subcontracted R&D that precludes use of the SME scheme). The much steeper contraction on the SME side suggests that smaller businesses were most affected in terms of dropping out or claiming less often in this period.
HMRC notes several policy changes that likely contributed to the decline in claim counts. Beginning in April 2023, the SME scheme became significantly less generous (the enhancement rate on R&D spending was cut from 130% to 86%, and the payable credit rate for loss-makers was cut from 14.5% to 10%), while the RDEC scheme became more generous (credit rate increased from 13% to 20%). Additionally, a new requirement was introduced: all claims filed from August 2023 onward must include a detailed Additional Information Form (aimed at improving compliance). These changes, alongside an increase in the main corporation tax rate (from 19% to 25%, affecting the effective savings from relief), have made it harder or less attractive for some small firms to claim, even as support for large firms grew. The net effect is a smaller number of claims overall, especially among SMEs.
Figure 1: Number of R&D tax credit claims by scheme (SME vs RDEC), 2016–17 through 2023–24. The chart shows claim volumes peaking around 2021–22 and then declining over the past two years, with a sharper fall in SME scheme claims compared to RDEC. These trends coincide with policy changes that reduced SME scheme generosity and increased the RDEC credit rate from April 2023.

If you’d like to know more about how Innovation Tax can help your business, please get in touch.
R&D Tax Relief Amount and R&D Expenditure
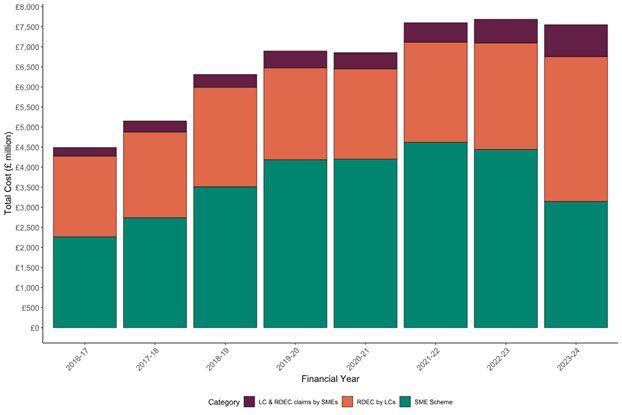
Despite the plunge in the number of claims, the total amount of R&D tax relief awarded has only marginally decreased. For 2023–24, companies claimed about £7.6 billion in R&D tax credits, which is a 2% drop from the £7.7 billion in the previous year. This relatively small decline in cost to the Exchequer (compared to the 26% fall in claim volume) underscores the fact that many of the forgone claims were on the smaller side. In effect, the average claim value jumped significantly – by roughly one-third – from the prior year. Fewer companies claimed, but those that did tended to claim larger amounts of relief.
A major shift occurred between the two R&D schemes: large companies now account for the majority of the relief value. Of the £7.6 billion total, the SME scheme (targeted at small and medium businesses) comprised about £3.15 billion, while the RDEC scheme (used by bigger firms and some subcontracting SMEs) accounted for roughly £4.41 billion. In the previous year the SME scheme had the larger share, so 2023–24 marks the first time that RDEC claims overtook SMEs in terms of total support claimed. The SME scheme’s contribution fell by 29% year-on-year, whereas the amount claimed via RDEC surged by 36%. This outcome is directly in line with the rate changes – with less generous SME credits and more generous RDEC credits, a greater portion of R&D support shifted toward the RDEC (large company) side.
It’s also informative to look at the qualifying R&D expenditure associated with these claims. In 2023–24, companies reported a total of £46.1 billion in R&D spending eligible for tax credits, a modest 1% decrease from the prior year. Notably, the bulk of this R&D expenditure – about 69% – was undertaken by companies claiming under the RDEC scheme (generally larger firms). This reflects the fact that large companies perform the lion’s share of R&D by value in the UK. The overall slight dip in R&D spending is much smaller than the drop in number of claims, suggesting that while many small claims disappeared, the total R&D investment was maintained at nearly the same level (likely concentrated in fewer, bigger projects).
Figure 2: Total amount of R&D tax credits claimed (in £ millions) by scheme, 2016–17 to 2023–24. This chart highlights how the composition of R&D support has changed over time. By 2023–24, claims under the RDEC scheme (primarily larger companies) have grown to exceed the total support claimed by SMEs. The jump in RDEC reflects the higher credit rate introduced in 2023, while SME support dropped after its rate was cut.
Regional Distribution of Claims and Expenditure
R&D tax credit activity remains unevenly distributed across the UK, heavily skewed toward certain regions. In the latest data, companies with registered addresses in London made about 24% of all R&D tax credit claims and received approximately 31% of the total relief amount – by far the highest share for any single region. The South East of England accounted for the next largest portion, with roughly 15% of all claims and 20% of the total amount claimed. The East of England was the third-highest, contributing around 10% of claims and 13% of claim value.
These three regions (London, South East, East of England) together made up nearly half of all claims and about two-thirds of the total relief claimed. Other regions, including large parts of the Midlands and North of England, Scotland, Wales, and Northern Ireland, each accounted for much smaller shares by comparison (generally single-digit percentages of the total). Importantly, HMRC cautions that this analysis is based on the location of companies’ registered offices, which may not be the location where R&D activities are actually performed. Many companies base their headquarters in London or the South East but conduct R&D at sites across the country. Nonetheless, the regional breakdown indicates a continued concentration of R&D tax credit uptake in and around the capital, consistent with previous years.
Industry Sector Breakdown
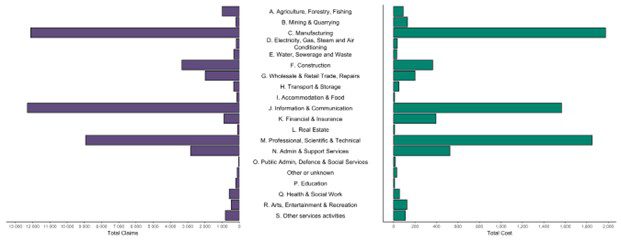
When examining R&D tax credits by industry sector, a clear pattern emerges: a handful of industries dominate the use of this incentive. In 2023–24, the top three sectors by volume of claims were Information & Communication, Manufacturing, and Professional, Scientific & Technical activities. These three sectors alone accounted for about 72% of all R&D tax credit claims, and roughly 71% of the total amount of relief claimed. In other words, the majority of companies claiming R&D credits – and the majority of the tax relief – are linked to high-tech, manufacturing, and scientific/professional services firms.
Looking at each of these leading industries in more detail: Information & Communication companies (which include software, IT, telecoms, and related tech firms) made about 26% of all claims and received around 21% of the total relief. Manufacturing firms likewise represented roughly 26% of claims, but due to typically larger claim sizes, they obtained about 26% of the total relief – the largest share by value of any sector. Professional, Scientific & Technical enterprises (which include R&D services, engineering firms, scientific research organisations, etc.) accounted for about 19% of claims and roughly 24% of the relief amount. These proportions are similar to those observed in previous years, indicating persistent sectoral patterns. Essentially, technology-related and industrial companies continue to be the primary users of R&D tax credits.
Figure 3: R&D tax credit claims and total amount claimed by industry sector for tax year 2023–24. A few sectors dominate both the number of claims and the value of relief, with Information & Communication, Manufacturing, and Professional/Scientific/Technical services leading the pack. Together, these top sectors account for the majority of R&D tax credit activity, reflecting where much of the UK’s reported R&D is occurring.
Beyond the top three, other sectors make up the remaining quarter of claims and relief. Some notable sectors include Finance & Insurance, Wholesale and Retail Trade, Construction, Education, Healthcare, and Agriculture. However, each of these individually contributes only a small fraction of total claims or relief (often just a few percent or less). The latest statistics also reveal that the downturn in claim volumes has been broad-based across sectors. When comparing the number of claims in 2023–24 to those in 2021–22 (the last year before the declines began), every industry sector saw a drop in claims. A few sectors experienced especially dramatic declines in claim counts over this two-year period – for instance, Accommodation & Food Services, Wholesale & Retail Trade (including repairs), Real Estate, and Education each saw their claim volumes plunge by over 70% since 2021–22. By contrast, the largest sectors (Information & Communication, Manufacturing, Professional/Scientific/Technical) saw much smaller declines in claim numbers, as did sectors like Mining & Quarrying and Agriculture, Forestry & Fishing. This indicates that the overall drop in R&D claims has hit certain industries far harder than others, with some of the more peripheral or smaller R&D-performing sectors contracting significantly in terms of tax credit participation.
R&D Claim Size Distribution
Another perspective comes from looking at the size of R&D tax credit claims. The data for 2023–24 show that the majority of claims are relatively small in value, but most of the money is in the largest claims. Specifically, about 61% of all R&D tax credit claims were for amounts of £50,000 or less in tax relief. These lower-band claims are typical of the SME scheme, where a small business might get a few thousand pounds to tens of thousands in tax reduction for its R&D spending. The abundance of small claims reflects the large number of small firms accessing the credit. However, this segment saw the biggest decline – the overall drop in claim counts from 2021–22 to 2023–24 was primarily due to fewer claims in the lowest value bands. In other words, many of the smallest claims disappeared, which aligns with the notion that more marginal or first-time claimants (often smaller companies with modest R&D) may have been deterred in the latest year.
On the other end of the spectrum, the very largest claims now make up a greater share of the total amount of relief than before. Claims resulting in over £1 million in tax credits (typically made by the largest R&D-performing companies) accounted for 54% of the total amount of relief claimed in 2023–24. This is a substantial concentration of relief in high-value claims, and notably, this share increased by 11 percentage points compared to the previous year. In 2022–23, the >£1m claims represented around 43% of the total relief, so the jump to 54% in 2023–24 underscores how the distribution has shifted upwards. The increase is partly attributed to the enhanced RDEC rate (20%) boosting the value of credits for big companies’ large R&D expenditures. It also reflects the decline of many small claims – with fewer small payouts, the large claims form a bigger piece of the pie. Overall, this shift towards larger claim sizes echoes the earlier points: fewer small firms claiming and more of the relief going to big projects and companies.
First-Time R&D Tax Credit Claimants
One concerning trend in recent years is a decline in the number of first-time applicants for R&D tax credits. According to HMRC’s figures, the 2022–23 tax year saw a significant drop in new claimants, and while complete data for 2023–24 first time claimants is not yet available, the pattern appears to be continuing. In 2022–23, the total number of companies claiming R&D tax relief for the first time was about 9,230, which represented a 41% decrease from the previous year’s new claimants. This was the fourth consecutive year that the count of first-time claimants fell year-on-year. (By contrast, before 2019–20, the number of new claimants had been rising annually as awareness and uptake of the credit grew.) The decline in new entrants suggests that fewer businesses are starting to use the R&D tax credit incentive recently, possibly due to the tightening of the scheme’s conditions and administrative requirements.
Breaking down the 2022–23 first-time claims by scheme: roughly 7,230 new claimants were under the SME scheme, a steep 45% drop from the prior year’s influx of new SME claimants. Meanwhile, around 2,000 first-time claimants used the RDEC scheme in 2022–23, which was about 21% fewer than the year before. The larger fall on the SME side again reflects how small companies have pulled back. This decline in fresh claimants is notable because it could indicate issues such as reduced outreach or awareness, higher barriers to entry (e.g. the new Additional Information Form requirement and other compliance measures may dissuade or delay new applicants), or simply fewer start-ups engaging in R&D. It will be important to watch how this trend evolves in the 2023–24 data (once available) and beyond, as a healthy pipeline of new R&D claimants is often seen as a sign of an innovative, growing economy.
Conclusion
In summary, HMRC’s September 2025 R&D Tax Credits Statistics reveal a shifting landscape for this important innovation incentive. The headline figures show that the total amount of support given to companies for R&D fell only slightly (by 2%) despite a dramatic decline in the number of claims (down 26%), implying that the average claim value rose substantially. This outcome is largely tied to policy reforms: from April 2023, the scheme became less generous for SMEs and more generous for large companies, leading to fewer small claims and a greater share of relief going to larger firms. Indeed, in 2023–24 the RDEC (large company) scheme surpassed the SME scheme in total relief provided for the first time.
The data also underscore that R&D tax credit usage remains concentrated – both geographically (with London and South East England dominating) and industrially (with tech, manufacturing, and scientific sectors accounting for the bulk of claims and spending). These concentrations have persisted over time. Meanwhile, the distribution of claim sizes has skewed more toward high-value claims, and the steady drop in first-time claimants suggests fewer new businesses are coming into the fold of R&D tax relief. All figures for 2023–24 are provisional (companies can continue to submit claims after this publication cutoff, so the numbers will be updated in the next release).
It should be noted that the 2023–24 stats capture the initial impact of the 2023 policy changes, but further reforms took effect from April 2024. Notably, the separate SME and RDEC schemes have since been replaced by a single, merged R&D credit scheme for all companies, alongside a special enhanced credit for R&D-intensive SMEs. These new regimes (sometimes called “RDEC 2.0” and ERIS for “Enhanced R&D Intensive Support”) will be reflected for the first time in the Autumn 2026 edition of HMRC’s statistics, which will cover the 2024–25 tax year. Policymakers and businesses will be keen to see in that next report how the landscape changes with the unified scheme – whether the trends observed in 2023–24 (such as the shift toward larger companies and claims) continue, level off, or reverse. For now, the 2025 publication provides a valuable snapshot of how the R&D tax credit system was being used at a moment of significant transition, highlighting the ongoing importance of a few key sectors and regions in driving UK R&D investment, as well as the sensitivity of the incentive’s uptake to policy adjustments and compliance efforts.
We're here to help
Contact us to discuss how the merged R&D scheme and the enhanced R&D-intensive SME relief could impact your business. With expert guidance, you can confidently navigate the new R&D tax landscape and continue to claim with confidence and certainty.